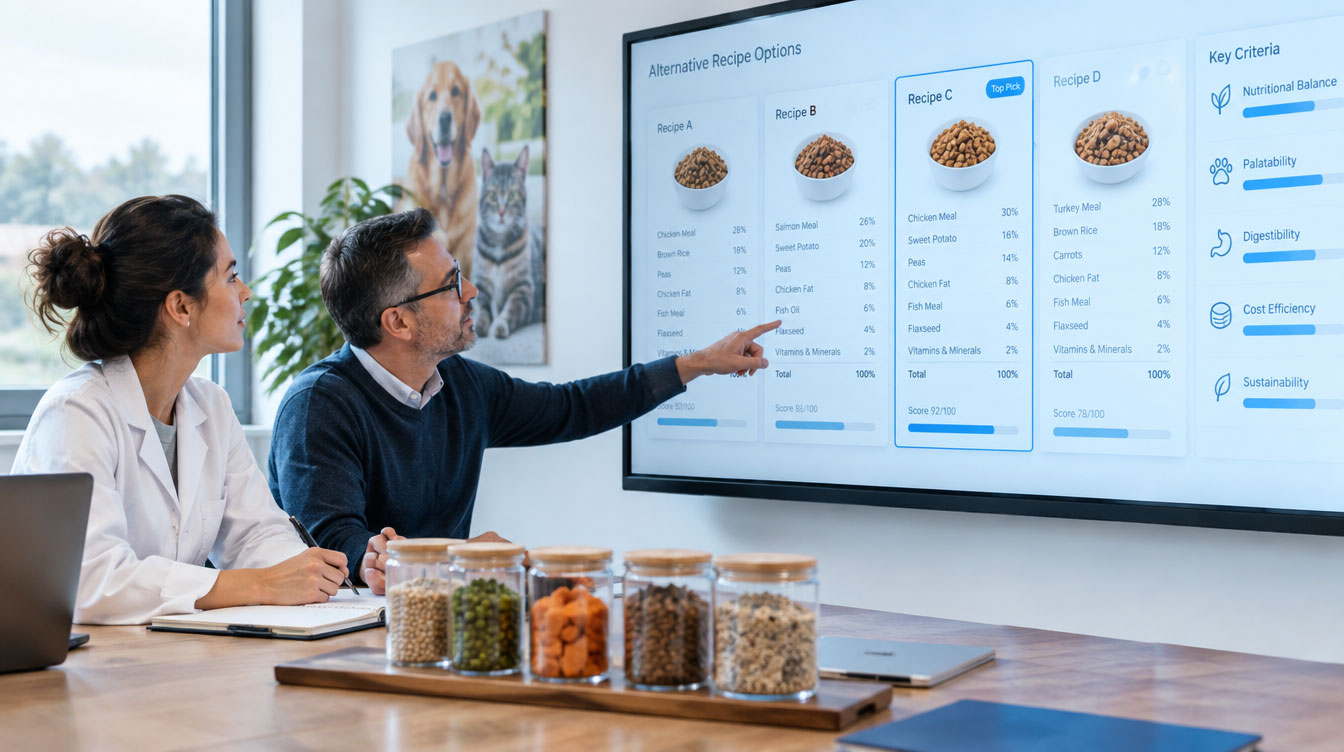


A dry dog food reformulation changes a protein ingredient while retaining the nutritional specification. Before making prototypes, the team asks how it will perform against the current product. A model predicts an intake ratio of 0.57.
Which product version is the control? Does 0.57 describe an average across dogs or pooled consumption? Was the model evaluated on new formulations?
A useful pet food palatability prediction defines its biological response and experimental context. That definition determines the training data, validation, and decisions the result can support.
What should a palatability prediction model predict?
It should predict a named endpoint that answers the development question. For comparative preference, that means a response of candidate A against comparator B in a defined population and protocol.
Paired testing measures relative preference; single-food acceptance testing asks whether the offered food is adequately consumed. A preference advantage does not establish adequate intake when offered alone. First choice and consumption also need distinct labels. [1]
For this reformulation, a proposed target is the expected trial-level mean intake ratio against the current recipe: average each dog's ratio across valid test days, then average across dogs. This is one possible definition, not a universal convention.
Define any acceptable loss separately. Predicting a ratio does not establish non-inferiority against a prespecified margin.
What does an intake ratio actually tell you?
Intake ratio expresses the share of combined consumption attributable to one food. For candidate A, it is A consumed divided by the total of A and B consumed. [1]
A ratio of 0.60 means 60% of the combined amount consumed was A. It does not mean "60% more palatable," a 60% probability of winning, or that 60% of animals preferred A.
Worked example: why aggregation changes the target. These invented observations illustrate arithmetic, not trial data or model outputs. Both foods use the same mass unit.
The mean of the two ratios is 0.40. Pooling consumption gives 7 ÷ 15, or approximately 0.467. The pooled calculation gives greater weight to the animal consuming more. Neither calculation is automatically wrong; they summarize different quantities.
Specify aggregation and exclusion rules before building training labels. When neither food is consumed, the denominator is zero; the ratio is undefined, not zero. Preserve observations and exclusion reasons so labels can be reconstructed.
Does every prediction need the same control recipe?
A fixed-control model needs a consistent reference; a model spanning different comparators needs to account for them. A result against the current product cannot automatically be interpreted as a result against a competitor.
Record control versions, batches, and relevant coating, processing, or storage differences. A recipe name alone may conceal changes in what animals received.
A fixed-control model may not need comparator inputs, but its applicability remains conditional on that reference. Models spanning several controls need to represent those comparisons and demonstrate performance for the intended comparator changes.
Keep historical comparisons intact. Two trials with an intake ratio of 0.60 against different controls do not establish equal absolute palatability. Pooling their labels without representing the comparison changes the meaning of the target.
What should the training records preserve?
Preserve enough information to reconstruct the response and its experimental context. The following is a proposed starting point.
Not every retained field belongs in the predictor. Animal and batch identifiers can be essential for analysis and validation without being appropriate inputs for scoring an unmanufactured recipe.
For pre-prototype screening, use information available at that stage. Planned process settings and measured production settings are different inputs. A model evaluated using measurements from finished prototypes has not thereby demonstrated performance using recipe information alone.
AFB International describes using formulation, processing, and historical trial data, with confidence informing experimental priorities. This is an industry example, not validation for another manufacturer's products. [2]
How should validation reflect the next formulation project?
Hold out the kind of novelty the model will encounter in use. Predicting another batch of a known recipe and predicting a new ingredient combination are different challenges.
For this substitution brief, evaluate held-out formulations representative of the proposed changes. Shared recipe families may support interpolation within those families without demonstrating performance on unfamiliar formulations.
Repeated observations from the same trial are not independent new formulation examples. Grouped validation can keep related records together; chronological evaluation can assess prediction on later observations. The split should match the deployment question. [3]
Every project need not hold out animals, batches, recipe families, and controls simultaneously. State what is shared and what is new, and limit the validation claim accordingly.
Prevent leakage throughout model development. Learn imputation, scaling, and feature selection from the training portion within each evaluation split. Keep the final test set out of model and tuning decisions. Applying those operations to the entire dataset first can produce optimistic results. [4]
What evidence makes the model useful?
Report performance in terms that match the decision, alongside a simple reference prediction. For intake-ratio regression, mean absolute error retains the target's units; correlation alone does not describe the size of prediction errors. [5]
Compare the model with a baseline defined using training data, such as the historical mean for the relevant fixed-control setting. Examine performance by the recipe groups that matter to the brief, rather than relying solely on an overall average.
For this project, we would also inspect errors near the acceptable-response boundary. A model useful for separating clearly poor candidates from clearly promising ones may still struggle to distinguish two close alternatives.
Agree in advance what error would change the prototype decision and what would make the model unsuitable. Report how many independent comparisons support that assessment.
What should "confidence" mean in the prediction report?
It should identify what is uncertain and how that uncertainty was assessed. Distinguish uncertainty about an expected response from variation in a future observed result.
A confidence interval for a mean response differs from a prediction interval for a future observation. The latter also accounts for variation in that observation. The appropriate calculation depends on the model and its assumptions. [6]
Here, define whether the interval concerns a future animal-level observation or the aggregated result of a future trial. Those targets involve different sources of variation. If intervals are reported, evaluate their coverage and width on data relevant to that target.
Return to the predicted ratio of 0.57. It is an estimate of the response we defined, not a probability of meeting the commercial requirement. Without an appropriate uncertainty assessment, the report should not attach that probability to it.
When is a model ready to inform FormuLogic?
When its target, inputs, validation evidence, and supported use are clear enough for the intended formulation decision.
FormuLogic's customer-specific predictive modeling involves developing and validating models using customer data, or building a tailored integration for an existing customer model. The relevant recipe space, comparator, and testing history have to be established for that engagement.
For the reformulation brief, retain a concise model specification: the control version, response calculation, required inputs, evaluation results, known limitations, and conditions requiring review. A new protein source, changed control, or different process may warrant further evidence before the previous validation is relied upon.
Record predictions before prospective testing, then compare them with observed results under the intended protocol. Investigate material discrepancies before extending the model's use. That gives the formulation team a traceable basis for deciding which predictions deserve weight.
Our AI-powered pet food formulation overview explains the broader workflow. The companion article examines how validated predictions should influence recipe generation and candidate selection.
Sources
- Simmons Pet Food. Principles of Pet Food Palatability: Evaluation. 2021. Industry technical paper: preference, acceptance, and intake-ratio definitions.
- AFB International. Leveraging Artificial Intelligence to Predict Pet Food Palatability. 2026. Company description of its predictive-development approach.
- Scikit-learn developers. Cross-validation: evaluating estimator performance. Technical documentation on grouped and time-dependent evaluation.
- Scikit-learn developers. Common pitfalls and recommended practices. Technical documentation on preprocessing and data leakage.
- Scikit-learn developers. Metrics and scoring: quantifying the quality of predictions. Technical documentation on regression evaluation.
- NIST/SEMATECH. How can I predict the value and estimate the uncertainty of a single response? e-Handbook of Statistical Methods. Mean-response uncertainty versus future-observation uncertainty.